Geometry is essential for physical fitness. Take a moment to write down a few ways in which geometry affects the precision of sport.
Discussion Questions
- What data is necessary to collect in order to understand the role of geometry in physical activity?
- What spatial perspectives and/or mathematical planes are important for precision?
The cover of The Geometry of Water Sports, to the right above, features a waterskier in action.
Discussion Questions
- What angles can be measured on the diagram, in order to understand the accuracy of technique?
- Is any essential information missing from the picture? What is necessary in order to measure that information?
Geometry diagrams featuring physical fitness activities are available in the following books from Schottenbauer Publishing, available in paperback and Kindle editions:
Geometry Workbooks
Additional Information
 How much sport science can be crammed into only 28 graphs? This question inspired a series of anthologies by Schottenbauer Publishing, spanning 10 popular Olympic and common sport topics.
Sport Science Anthologies
How much sport science can be crammed into only 28 graphs? This question inspired a series of anthologies by Schottenbauer Publishing, spanning 10 popular Olympic and common sport topics.
Sport Science Anthologies
- Physical Fitness
- Summer Olympic Sports
- Winter Olympic Sports
- Gymnastics
- Track & Field
- Ball Sports
- Dance & Ballet
- Yoga
- Figure Skating
- Ice Hockey
Video Analysis
- Jumping Jack
- Pedaling on Bike
Goniometer
- Seated Knee Extensions
- Jogging in Place
Spirometer
- Normal Breathing
- After 5 Minutes Jogging (& Continuing to Jog)
Electromyogram
- Arm Relaxed
- Arm Held Straight Up
- Arm while Jogging
- Arm during Bicep Curls
- Quadricep During Vertical Squat
Electrocardiogram
- Before Cycling
- After 5 Minutes Cycling
- 4 Minutes After Ending Cycling
Discussion Questions
- What comparisons and contrasts can be made with this data?
- What additional data would be useful to obtain?
The following books from Schottenbauer Publishing contain a more extensive collection of graphs and data pertaining to the science of athletic training:
Graphs & Data for Science Lab: Multi-Volume Series
- The Science of the Athletic Training
- Volume 1: Force, Velocity, Acceleration
- Volume 2: Biophysics
- Volume 3: Video Analysis
- Volume 4: Video Analysis
- The Science of Exercise Equipment
- Volume 1: Force, Velocity, Acceleration
- Volume 2: Biophysics
- Volume 3: Video Analysis
- Volume 4: Video Analysis
- The Science of Gymnastics
- Volume 1: Force, Velocity, Acceleration
- Volume 2: Biophysics
- Volume 3: Video Analysis
- Volume 4: Video Analysis
- The Science of Yoga, Pilates, & Ballet
- Volume 1: Force, Velocity, Acceleration
- Volume 2: Biophysics
- Volume 3: Video Analysis
- Volume 4: Video Analysis
Additional Information
How do the motions of walking, jogging, and running compare to each other? Graphs from the book series Walk, Jog, & Run: The Science of Athletic Training from Schottenbauer Publishing provide several types of data to answer this question.
- Volume 1
- Force Plate
- Wireless Dynamics Sensor for Acceleration
- Volume 2
- Goniometer for Joint Angle Measurements
- Spirometer for Breathing Rate
- Electromyograph (EMG) Electrical Activity of Muscles
- Electrocardiogram (EKG) Electrical Activity of Heart
- Blood Pressure and Pulse
- Volume 3
- Video Analysis of Trajectory
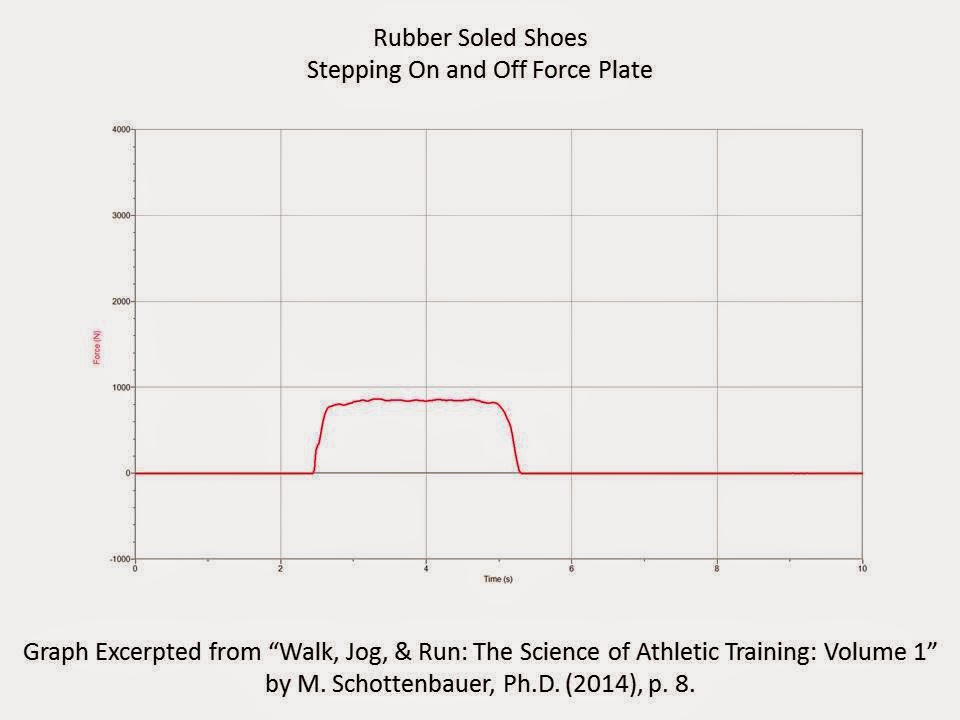
The graphs below provide samples of data from Volumes 1, 2, and 3 of Walk, Jog, & Run: The Science of Athletic Training.
Discussion Questions
- What does the graph above show?
- What are the minimum and maximum values on the graph?
- How much does the person weigh?
- What might the graph look like if the person were jogging or running on the plate?
Discussion Questions
- What does the graph above show?
- What are the minimum and maximum values on the graph?
- How fast is the person jogging in place?
- What might the graph look like if the person were jogging forward?
- What might the graph look like if the person were walking or running forward?
Discussion Questions
- What does the graph above show?
- What are the minimum and maximum values on the graph?
- How fast is the person running?
- What might the graph look like if the person were walking or jogging?
Each book in the series Walk, Jog, & Run: The Science of Athletic Training provides additional graphs comparing walking, jogging, and running. Volume 3 also provides separate graphs for each body part, which may facilitate graphical analysis of motion.
The following books from Schottenbauer Publishing contain similar types of graphs and data pertaining to the science of athletic training:
Graphs & Data for Science Lab: Multi-Volume Series
- The Science of the Athletic Training
- Volume 1: Force, Velocity, Acceleration
- Volume 2: Biophysics
- Volume 3: Video Analysis
- Volume 4: Video Analysis
- The Science of Exercise Equipment
- Volume 1: Force, Velocity, Acceleration
- Volume 2: Biophysics
- Volume 3: Video Analysis
- Volume 4: Video Analysis
- The Science of Gymnastics
- Volume 1: Force, Velocity, Acceleration
- Volume 2: Biophysics
- Volume 3: Video Analysis
- Volume 4: Video Analysis
- The Science of Yoga, Pilates, & Ballet
- Volume 1: Force, Velocity, Acceleration
- Volume 2: Biophysics
- Volume 3: Video Analysis
- Volume 4: Video Analysis
Anthologies of 28 Graphs
- The Science of Physical Fitness
- The Science of Summer Olympic Sports
- The Science of Winter Olympic Sports
- The Science of Gymnastics
- The Science of Yoga
- The Science of Dance & Ballet
Additional Information