Bicycling provides excellent examples of motion for physics education. Road bikes demonstrate a combination of translational and rotational motion, while stationary bicycles demonstrate the rotational motion of the wheel.
The graph below, excerpted from The Science of Exercise Equipment, Volume 1, shows the acceleration, force, and altitude changes associated with the rotational motion of a recumbent stationary bicycle.
Discussion Questions
- What are the minimum and maximum points on each graph?
- Why does the graph show acceleration in three directions of motion? Describe how each component, including x, y, and z, relates to the motion of the ankle.
- What aspect of bicycle motion is normally modeled by a sine wave?
- Can any of these graphs be modeled with a sine wave? Why or why not?
- What is the period and frequency of the motion in the graph?
- Does the athlete change speed during the motion recorded in the graph? Why or why not?
- What is more useful for analyzing the motion of the wheel: a) the total force, b) the x, y, and z acceleration? Why?
- Is the athlete pedaling forwards or backwards?
The free YouTube video, Understanding the Motion of the Wheel from Schottenbauer Publishing, provides graphical analysis of video footage. In the video, spatial analysis of motion (e.g., what does the motion look like to a viewer) is compared to graphical analysis of motion (e.g., what does the motion look like in a graph). This video can supplement traditional lectures on the science of basic motion. The video, shown below, is discussed in detail in the blog post Understanding Translational and Rotational Motion from a Bicycle Wheel on the blog The Science of Transportation.
The following books from Schottenbauer Publishing contain similar types of graphs and data pertaining to the science of bicycles:
Graphs & Data for Science Lab: Multi-Volume Series
- The Science of the Wheel
- Volume 1: Force, Velocity, Acceleration
- Volume 2: Video Analysis, Force, Velocity, Acceleration
- Volume 3: Video Analysis, Force
- The Science of Exercise Equipment
- Volume 1: Force, Velocity, Acceleration
- Volume 2: Biophysics
- Volume 3: Video Analysis
- Volume 4: Video Analysis
Anthologies of 28 Graphs
- The Science of Transportation
- The Science of Physical Fitness
- The Science of Summer Olympic Sports
Additional Information
How do the motions of walking, jogging, and running compare to each other? Graphs from the book series Walk, Jog, & Run: The Science of Athletic Training from Schottenbauer Publishing provide several types of data to answer this question.
- Volume 1
- Force Plate
- Wireless Dynamics Sensor for Acceleration
- Volume 2
- Goniometer for Joint Angle Measurements
- Spirometer for Breathing Rate
- Electromyograph (EMG) Electrical Activity of Muscles
- Electrocardiogram (EKG) Electrical Activity of Heart
- Blood Pressure and Pulse
- Volume 3
- Video Analysis of Trajectory
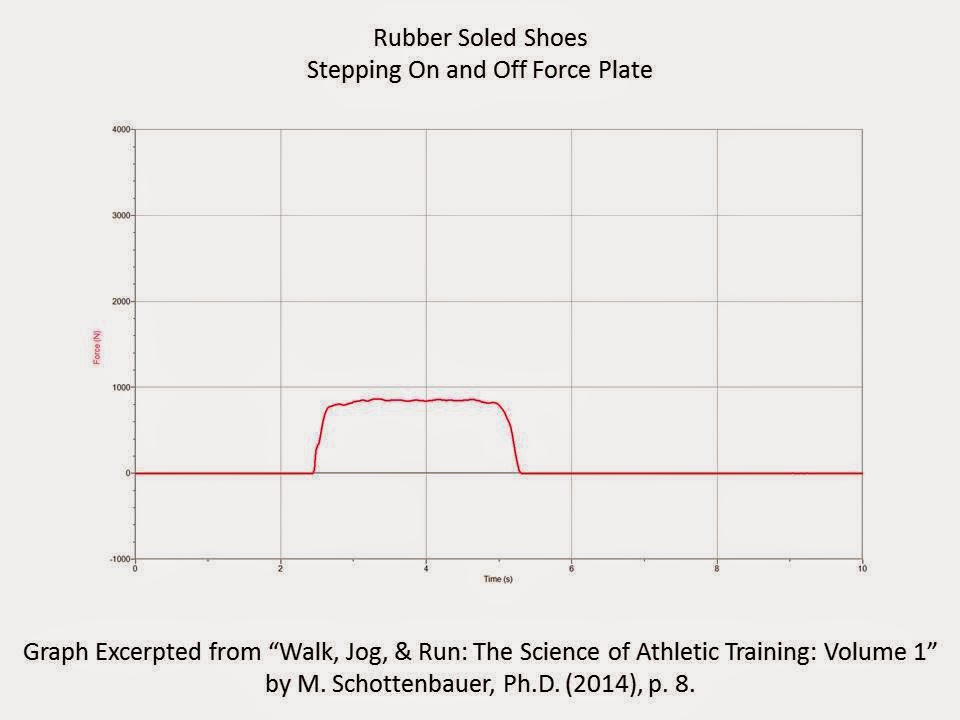
The graphs below provide samples of data from Volumes 1, 2, and 3 of Walk, Jog, & Run: The Science of Athletic Training.
Discussion Questions
- What does the graph above show?
- What are the minimum and maximum values on the graph?
- How much does the person weigh?
- What might the graph look like if the person were jogging or running on the plate?
Discussion Questions
- What does the graph above show?
- What are the minimum and maximum values on the graph?
- How fast is the person jogging in place?
- What might the graph look like if the person were jogging forward?
- What might the graph look like if the person were walking or running forward?
Discussion Questions
- What does the graph above show?
- What are the minimum and maximum values on the graph?
- How fast is the person running?
- What might the graph look like if the person were walking or jogging?
Each book in the series Walk, Jog, & Run: The Science of Athletic Training provides additional graphs comparing walking, jogging, and running. Volume 3 also provides separate graphs for each body part, which may facilitate graphical analysis of motion.
The following books from Schottenbauer Publishing contain similar types of graphs and data pertaining to the science of athletic training:
Graphs & Data for Science Lab: Multi-Volume Series
- The Science of the Athletic Training
- Volume 1: Force, Velocity, Acceleration
- Volume 2: Biophysics
- Volume 3: Video Analysis
- Volume 4: Video Analysis
- The Science of Exercise Equipment
- Volume 1: Force, Velocity, Acceleration
- Volume 2: Biophysics
- Volume 3: Video Analysis
- Volume 4: Video Analysis
- The Science of Gymnastics
- Volume 1: Force, Velocity, Acceleration
- Volume 2: Biophysics
- Volume 3: Video Analysis
- Volume 4: Video Analysis
- The Science of Yoga, Pilates, & Ballet
- Volume 1: Force, Velocity, Acceleration
- Volume 2: Biophysics
- Volume 3: Video Analysis
- Volume 4: Video Analysis
Anthologies of 28 Graphs
- The Science of Physical Fitness
- The Science of Summer Olympic Sports
- The Science of Winter Olympic Sports
- The Science of Gymnastics
- The Science of Yoga
- The Science of Dance & Ballet
Additional Information
Are you interest in learning about the science of physical fitness? Books from Schottenbauer Publishing provide detailed information about exercise science, suitable for education from elementary through high school and college/university classes. Selections include multi-volume series with graphs from athletic training, exercise equipment, and other sport topics, as well as anthologies of 28 graphs demonstrating a variety of mathematical functions related to specific sports topics! Plus, geometry workbooks contain action diagrams of athletic moves, providing exciting opportunities for children to learn about angles and measurement!
Books are available from CreateSpace wholesale, as well as Amazon, Barnes & Noble, Books-a-Million, and other internet retailers!
Schottenbauer Publishing also offers free blogs on specific sport science topics, featuring free graphs, discussion questions, and videos.
Sport Science Blogs FREE!
Additional Information